Prof. Jason P. Evans
Climate Change Research Centre
University of New South Wales


NARCliM model performance including teleconnections with climate modes.
J.P. Evans, R. Olson, L. Fita, D. Argueso and A. Di Luca
In Weber, T., McPhee, M.J. and Anderssen, R.S. (eds) MODSIM2015, 21st International Congress on Modelling and Simulation. Modelling and Simulation Society of Australia and New Zealand, December 2015, pp. 1531-1536. ISBN: 978-0-9872143-5-5, 2015. Abstract
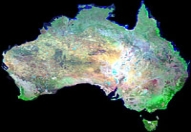
NARCliM (NSW/ACT Regional Climate Modelling project) is a regional climate modelling
project for the Australian area. It provides a dynamically downscaled climate dataset for the CORDEX-
AustralAsia region at 50km, and South-East Australia at a resolution of 10km. NARCliM data is being used
by the NSW and ACT governments to design their climate change adaptation plans. Data is available through
the AdaptNSW website (http://climatechange.environment.nsw.gov.au/).
NARCliM uses version 3.3 of the Weather Research and Forecasting (WRF) regional climate model (RCM)
to perform an ensemble of simulations for the present and the projected future climate. WRF is run in three
different model configurations (different combinations of physical parametrizations) that have been shown to
perform well in the South-East Australia and were chosen based on performance and independence. These
three RCMs are used to simulate three different periods: 1990-2009, 2020-2039 and 2060-2079. Four
different Global Climate Models (GCMs: MIROC-medres 3.2, ECHAM5, CCCMA 3.1 and CSIRO mk3.0)
from CMIP3 are used as initial and boundary conditions for the WRF simulations. These GCMs were chosen
through a process that considered model performance, independence and projected future changes. Thus a
RCM ensemble of 12 simulations for each period is obtained. Additionally to the GCM-driven simulations, 3
control run simulations driven by the NCEP/NCAR reanalysis for the entire period of 1950-2009 are also
performed in order to evaluate the RCMs performance in the area.
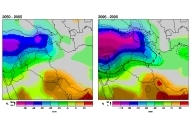
The NARCliM ensemble is found to have a consistent cold bias throughout the year with many areas
showing the ensemble members significantly agreeing on the bias. This bias is significant over most of
southeast Australia in winter and summer. The ensemble also displays a consistent wet bias with most of
southeast Australia showing significant agreement amongst ensemble members on this bias in summer and
autumn. A dry bias is present on the southeast coast in winter
The regional models are found to do a reasonably good job at capturing the teleconnections with large scale
climate modes such as El Niño – Southern Oscillation (ENSO), when compared to the driving global data.
Each regional model displays differing strengths and weaknesses in this respect.
Key Figure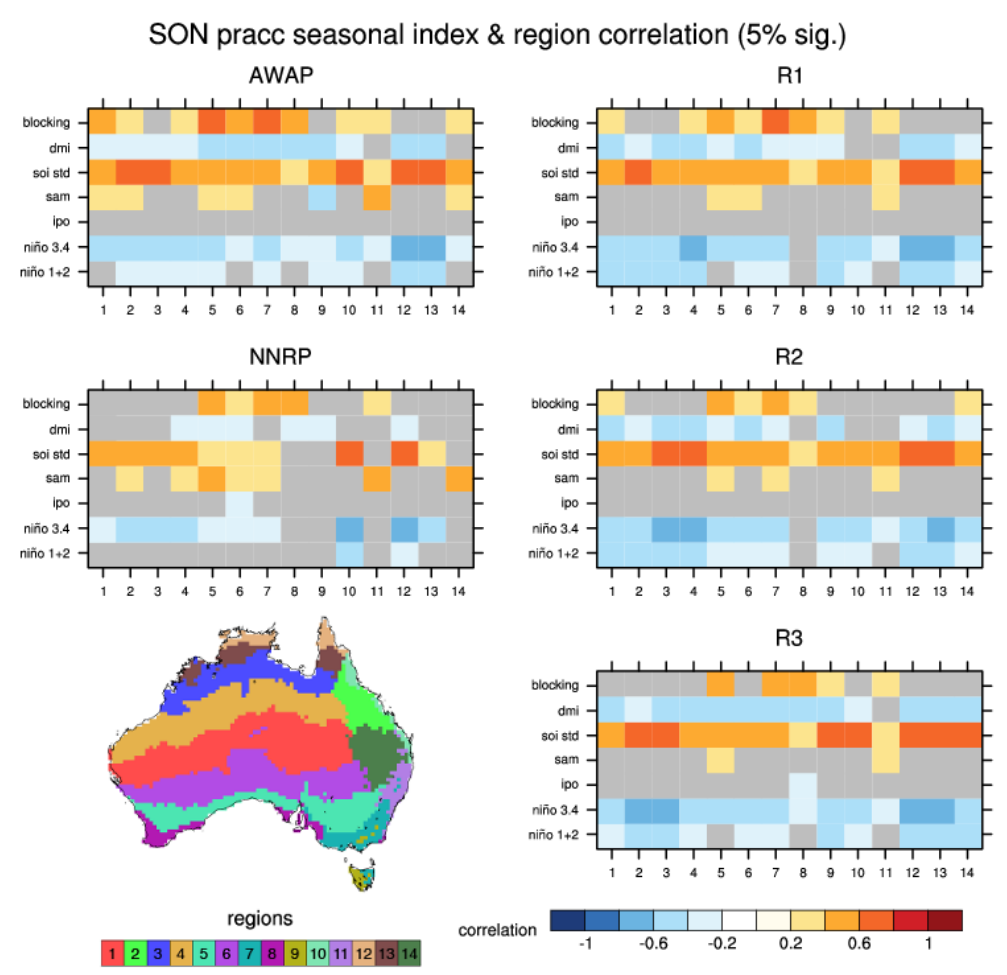 Figure 2. September-October-November regional spatial mean time-series correlation with different climatological indices for precipitation (pracc) in observations (AWAP), NNRP reanalysis and three regional climate model configurations using NNRP as input. Only correlation values above the 95 % confidence level are plotted. Blocking = atmospheric blocking in the Tasman Sea, DMI = Dipole Mode Index, SOI STD = Southern Oscillation Index standard deviation, SAM = Southern Annular Mode, IPO = Inter-decadal Pacific Oscillation, NINO3.4 = sea surface temperature in the 3.4 box in the Pacific (a measure of the El Nino Southern Oscillation, NINO1+2 = as for NINO3.4 but in the 1 and 2 boxes |
|